
FIG 6.
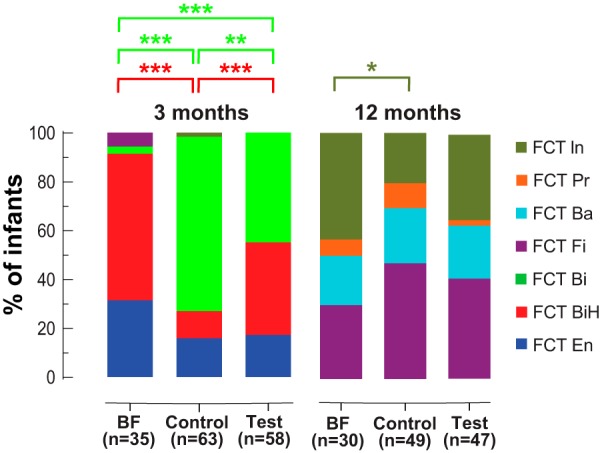
Distribution of fecal community types among feeding groups at two time points. Significant differences are shown using the FCT color code. *, P < 0.05; **, P < 0.01; ***, P < 0.001; NS, not significant; n, number of samples.
Official websites use .gov
A
.gov website belongs to an official
government organization in the United States.
Secure .gov websites use HTTPS
A lock (
) or https:// means you've safely
connected to the .gov website. Share sensitive
information only on official, secure websites.
Distribution of fecal community types among feeding groups at two time points. Significant differences are shown using the FCT color code. *, P < 0.05; **, P < 0.01; ***, P < 0.001; NS, not significant; n, number of samples.