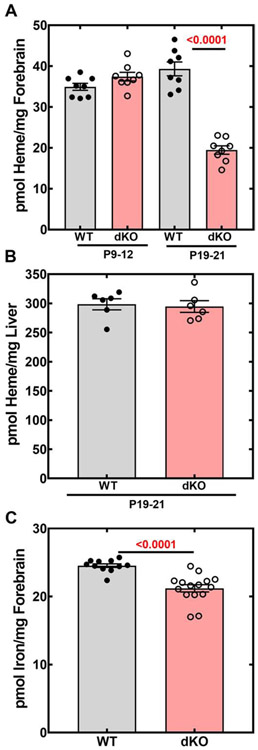
Fig. 10.
Heme levels in brain and liver; iron levels in brain. Heme was measured in forebrain and liver by HPLC from wild-type (WT) and Pank1−/−Syn-Pank2−/− (dKO) mice as described in Materials and methods. Iron levels from the forebrain in the WT and dKO mice at P19-21 were assayed as described in Materials and methods. A. Heme levels in forebrain, n=8 mice in each group. B. Heme levels in liver, n= 6 mice in each group. C. Iron levels in brain, n=15 for WT and n=11 for dKO mice at P19-21. The data represent the mean values for each genotype ± SEM and statistical significance was calculated using the parametric t-test comparing age matched WT and dKO mice for the heme assay and the nonparametric t-test for the iron measurement, the values for which are shown in red.

