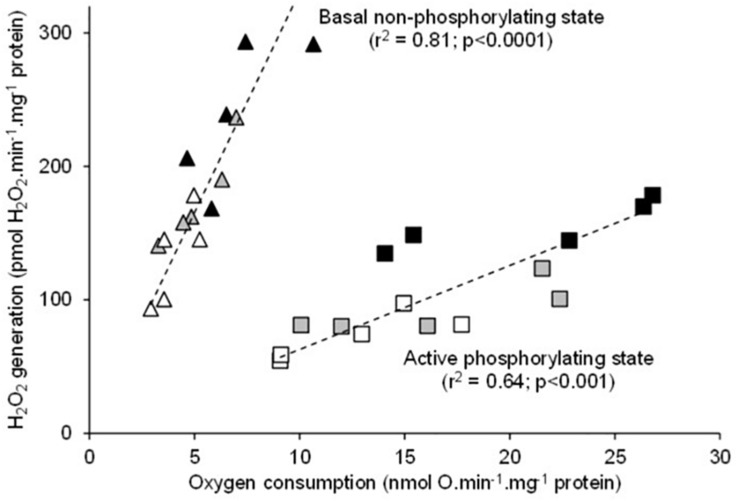
FIGURE 3.
Relationship between the individual H2O2 production and the mitochondrial oxygen consumption rates during fueling with succinate alone (basal non-phosphorylating state) or with succinate and ADP (active phosphorylating state). The individual values show five independent mitochondrial preparations from the liver of toad measured at 20°C (white circles), at 25°C (gray circles), and at 30°C (black circles).

