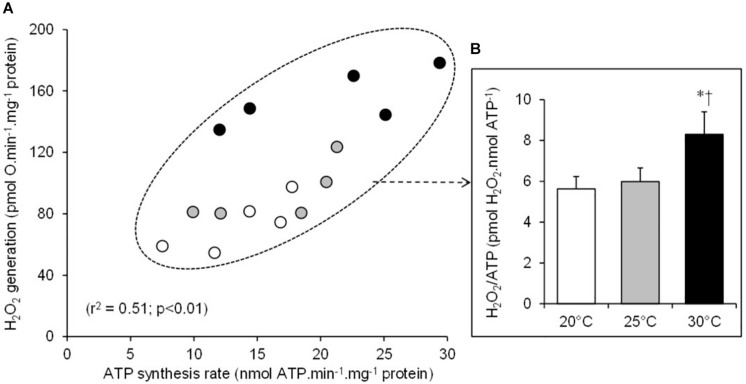
FIGURE 4.
Relationship between the individual H2O2 production and the mitochondrial ATP synthesis rates (A). The individual values show five independent mitochondrial preparations from the liver of toad measured at 20°C (white circles), at 25°C (gray circles), and at 30°C (black circles). (B) The oxidative cost of ATP production (% H2O2/ATP ratio) calculated at 20°C (white bars), at 25°C (gray bars), and at 30°C (black bars). The values are means ± SEM for N = 5 independent mitochondrial preparations. * and † mean significantly different from 20 and 25°C, respectively (p < 0.05).

