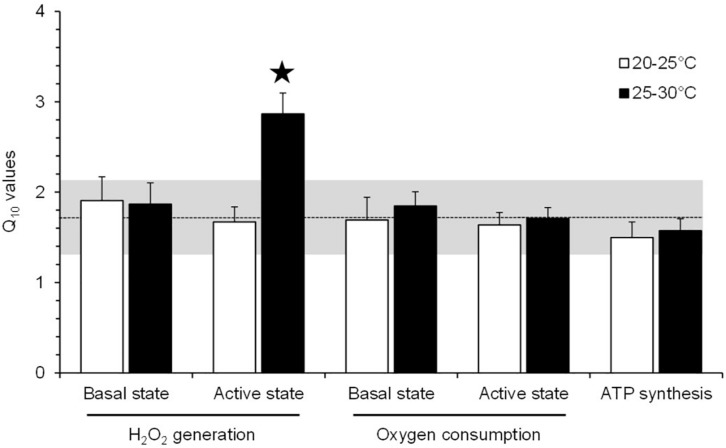
FIGURE 5.
Q10 values for the effect of acute temperature change on the mitochondrial parameters of toad liver. The values are means ± SEM for N = 5 independent mitochondrial preparations. *Significantly different from all of the other Q10 values (p < 0.05). The dashed line represents the mean of Q10 values for all mitochondrial parameters (±SD is represented by the horizontal gray-shaded rectangle), excluding the Q10(25–30°C) value for the H2O2 production under an active phosphorylating state.

