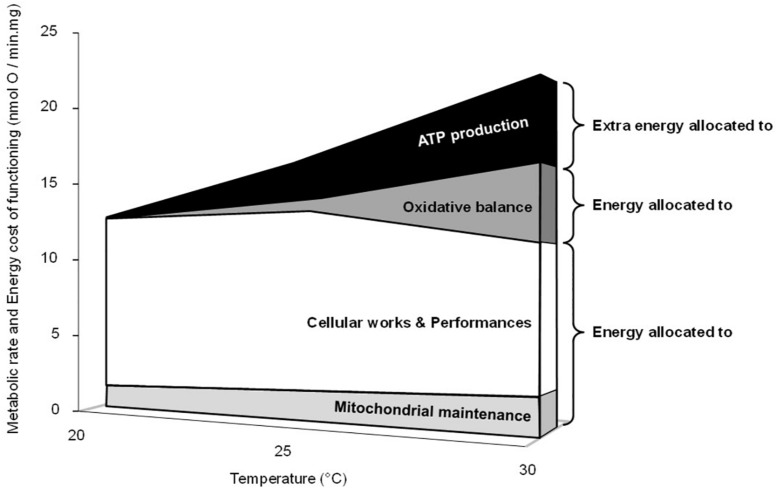
FIGURE 6.
Synoptic summary of the effects of acute temperature change on mitochondrial metabolism and energy costs. The upper limit in the figure represents the positive thermal effect on the maximal phosphorylating oxygen consumption rates (active states in Table 1), which is linearly related to the rates of ATP synthesis (Figure 1A). The “extra energy allocated to ATP synthesis” is related to the thermal decrease of the coupling efficiency and represents the extra oxygen needed to produce a given amount of ATP. It was calculated by using the percent changes in effective coupling efficiency measured at 25 and 30°C compared with values at 20°C (-15 and -22%, respectively; Figure 1B). The “energy allocated to oxidative balance,” the “oxidative cost,” is related to the thermal increase in H2O2 generation. It was calculated by using the mean value of the differences between the ratios%H2O2/O and%H2O2/ATP measured in the phosphorylating active state at 25°C or at 30°C and values measured at 20°C (+7 and +33%, respectively; Table 1 and Figure 4B). “Mitochondrial maintenance” represents the need for oxygen and substrate consumption to counteract proton leakage and maintain the mitochondrial membrane potential value in active state. Even though the mitochondrial proton leakage is low in the phosphorylating active state, it still occurs, representing between 10 and 15% of the maximal phosphorylating oxygen consumption rate in liver mitochondria (Brand et al., 1993; Roussel et al., 2004, 2018). Here we used the fix value of 11%, arguing that the thermal increase in membrane conductance and subsequent proton leakage was counterbalanced by the thermal increase in the activity of the electron transport system (Table 1).

