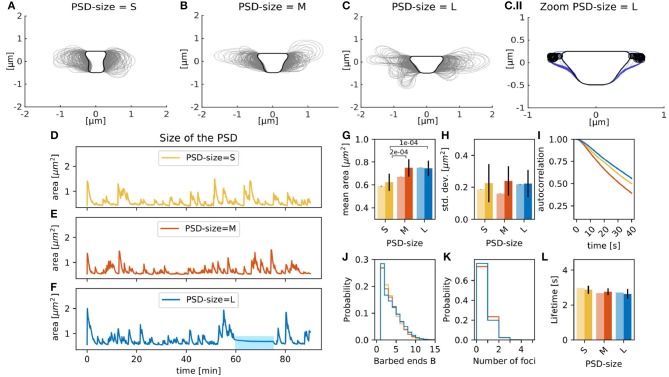
Figure 4.
Spines with varying PSD size. Spine shapes (gray lines, plotted every 15 s) over 90 min of simulation for (A) small, (B) medium, and (C) large sized PSDs. Black line corresponds to the resting shape. (C.II) Shapes of the large PSD-size spine between min 60 and 70 (color-coded from dark to light blue). Black open circles correspond to the nucleation points. (D–F) Evolution of the spine area over time. (G) Temporal mean over area in 90 min simulation (pale bars, errors are standard deviations over 50 bootstraps) and average of temporal means over fifteen 15 min simulations (saturated color, errors are standard deviations of the mean) over different PSD sizes. The p-value for significant Welch-tests is indicated. (H) Same as (G) but for standard deviation of the area fluctuations. (I) Autocorrelation functions for the area fluctuations in the 90 min simulations. (J) Histogram of the mean number of barbed ends at the polymerization foci at each time-step of the 90 min simulation. (K) Histogram of the active actin polymerization foci. (L) Mean lifetime of a focus, color-coded as in (G).

