Figure 6.
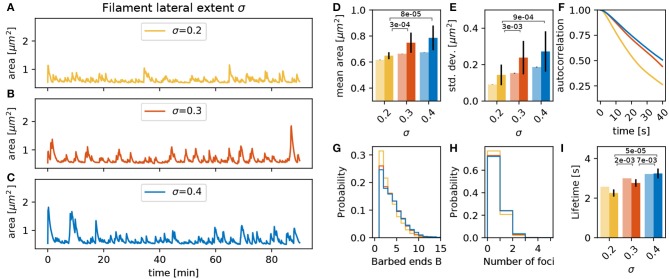
Varying the filament lateral extent σ. (A–C) Evolution of the spine head area over time for different values of σ: (A) σ = 0.2, (B) σ = 0.3, and (C) σ = 0.4. (D) Temporal mean of the spine head area. Light bars correspond to values from single 90 min simulations (standard deviations obtained from 50-fold bootstrap). Full colored bars and errors correspond to the mean and standard deviation over fifteen 15 min simulations. The p-value for significant Welch-tests is indicated. (E) Standard deviation of the spine head area over time. (F) Autocorrelation functions for the area fluctuations in the 90 min simulations. (G) Relative frequency of the mean number of barbed ends per focus over all simulation time-steps in (A–C). (H) Relative frequency of the number of actin polymerization foci. (I) Mean lifetime of a focus.

