Figure 4.
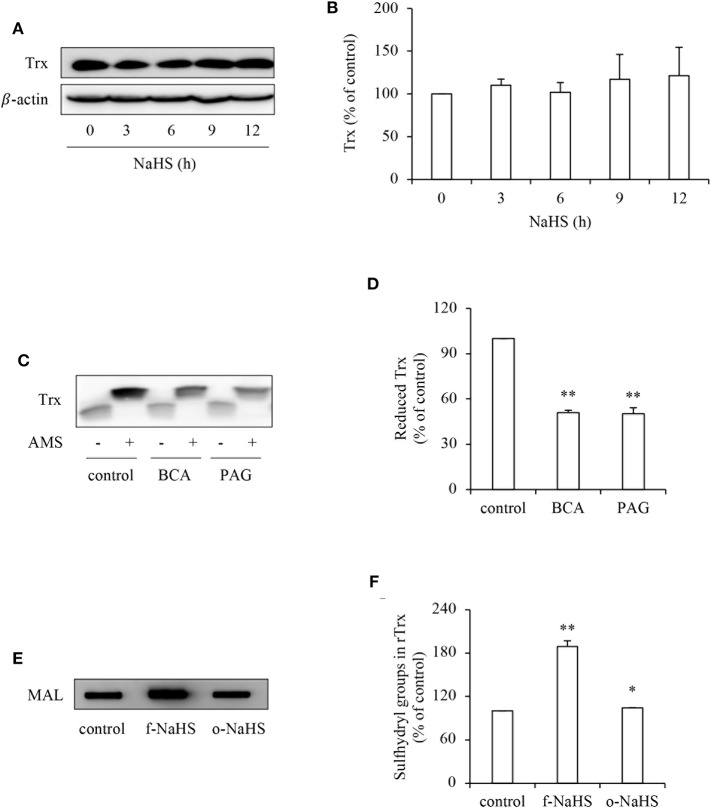
Effect of H2S on the redox state of Trx. (A,B) Effect of NaHS on Trx protein levels in HepG2 cells. HepG2 cells were exposed to 1 mM NaHS for the indicated time intervals. Cellular lysates were subjected to Western blot analysis of Trx (A). Densitometric analysis of the blot in (A) was shown in (B). Data shown are mean ± SE, (n = 3). (C,D) Effect of endogenous H2S on the redox state of Trx. HepG2 cells were cultured with or without 2 mM BCA or 3 mM PAG for 12 h. Cellular proteins precipitated by TCA were dissolved in lysis buffer and allowed to react with thiol-binding AMS as described in Materials and Methods. The redox state of Trx was determined through the shift of Trx bands in western blot analysis. Note the obvious reduction of AMS-labeled reduced form of Trx (upper band; C). Densitometric analysis of the blot in (C) is shown in (D). Data shown are mean ± SE, (n = 3, **P < 0.01 vs. control). (E,F) Effect of H2S on redox state of rTrx. rTrx (2 μg) was exposed to 1 mM freshly prepared NaHS solution (f-NaHS) for 2 h or solution that had been exposed to air for 2 days before the experiments (old NaHS: o-NaHS). The binding of fluorescence-labeled maleimide (MAL) was evaluated through the fluorescent intensity in dot blot (E). Densitometric analysis of the blot was shown in (F). Data shown are mean ± SE, (n = 3; *P < 0.05, **P < 0.01 vs. control).

