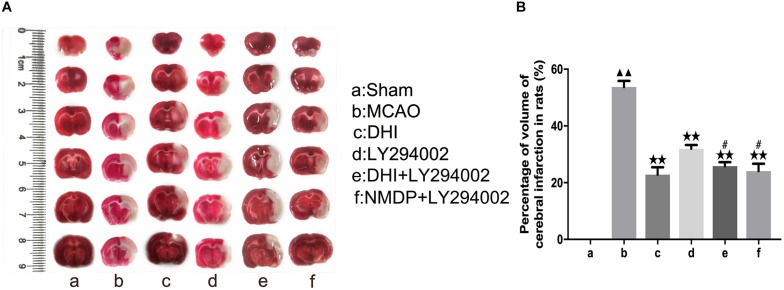
FIGURE 3.
The cerebral infarct volume of rats after cerebral ischemia-reperfusion injury by MCAO with TTC staining. (A) Results of TTC staining in each group. (B) Statistical results of cerebral infarct volume in each group (n = 3). Compared with the sham group, ▲▲p < 0.01; compared with the MCAO group, **p < 0.01; compared with the LY294002 group, #p < 0.05. Sham, sham operation group; MCAO, middle cerebral artery occlusion; LY294002, 2-(4-morpholinyl)-8-phenyl-chromone; DHI, Danhong Injection; NMDP, nimodipine.

