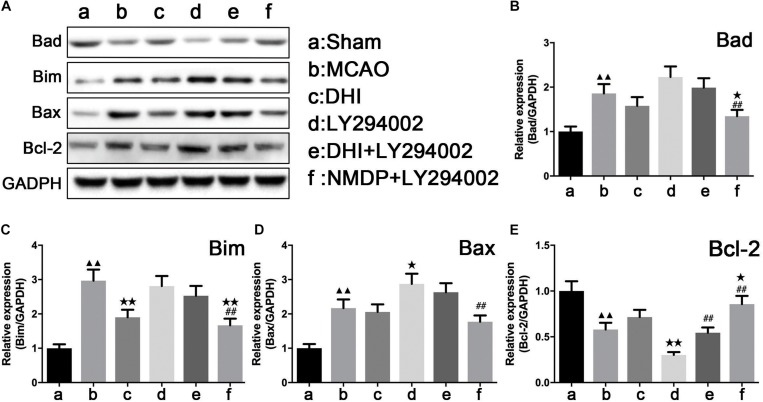
FIGURE 8.
The protein strip diagram and protein expressions level of apoptosis-related factors in each group. (A) Band diagrams of Bad, Bim, Bax, and Bcl-2 in brain tissue of each group of rats determined by western blot. (B) The expression of Bad in brain tissue of each group rats determined by western blot. (C) The expression of Bim in brain tissue of each group rats determined by western blot. (D) The expression of Bax in brain tissue of each group rats determined by western blot. (E) The expression of Bcl-2 in brain tissue of each group rats determined by western blot (n = 4). Compared with the sham operation group, ▲▲p < 0.01; compared with the MCAO group, *p < 0.05, **p < 0.01; compared with the LY294002 group, ##p < 0.01. Sham, sham operation group; MCAO, middle cerebral artery occlusion; LY294002, 2-(4-morpholinyl)-8-phenyl-chromone; DHI, Danhong Injection; NMDP, nimodipine.

