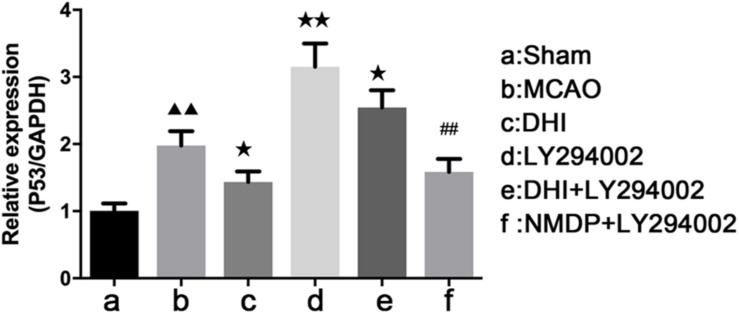
FIGURE 9.
The p53 mRNA expression level in each group determined by qRT-PCR (n = 4). Compared with the sham operation group, ▲▲p < 0.01; compared with the MCAO group, *p < 0.05, **p < 0.01; compared with the LY294002 group, ##p < 0.01. Sham, sham operation group; MCAO, middle cerebral artery occlusion; LY294002, 2-(4-morpholinyl)-8-phenyl-chromone; DHI, Danhong Injection; NMDP, nimodipine.

