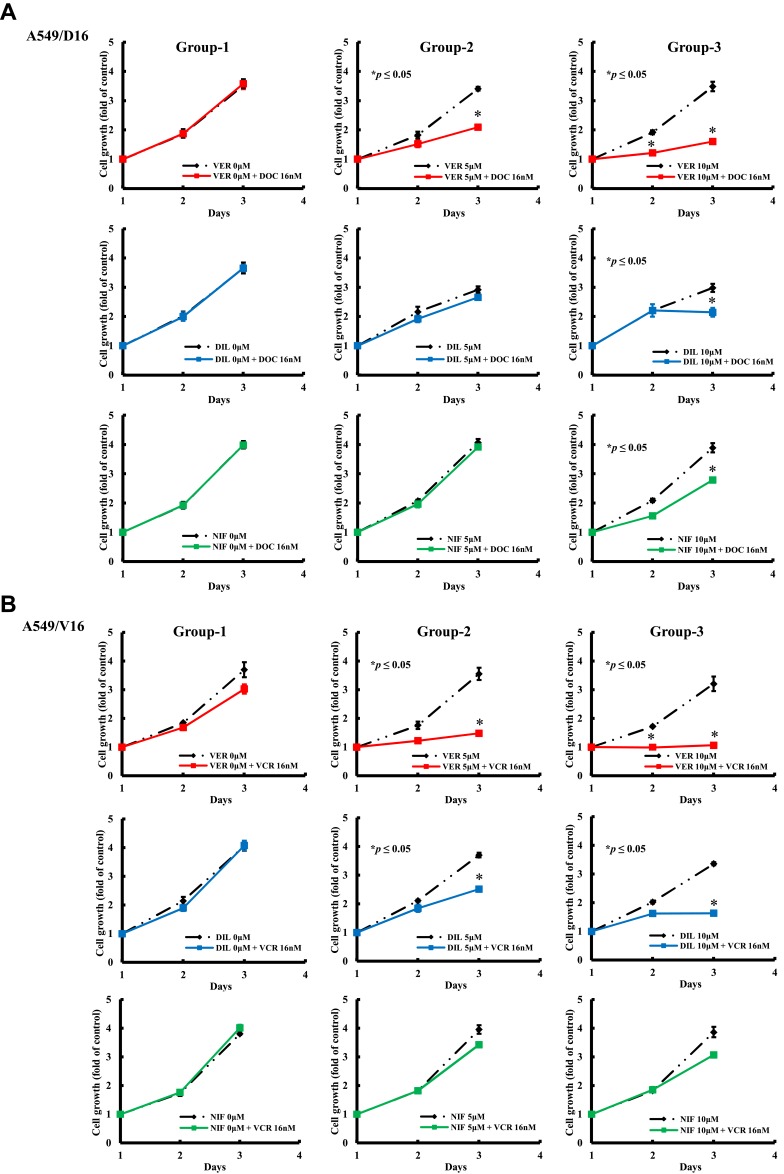
Figure 4.
Analysis of the growth inhibition effect of individual CCBs on A549 chemoresistant sublines analyzed by MTT assay. Group-1 compared chemoresistant A549/D16 cells (A) treated with DOC (16 nM) to blank control cells, and group-2 compared cells treated with CCB (5 μM) only with cells treated with CCB (5 μM) combined with DOC (16 nM). Group-3 compared cells treated with CCB (10 μM) with cells treated with CCB (10 μM) and DOC (16 nM). The data were analyzed by MTT assay for three-day periods. Similar conditions for A549/V16 subline were applied and studied (B). *p<0.05 was considered statistically significant.

