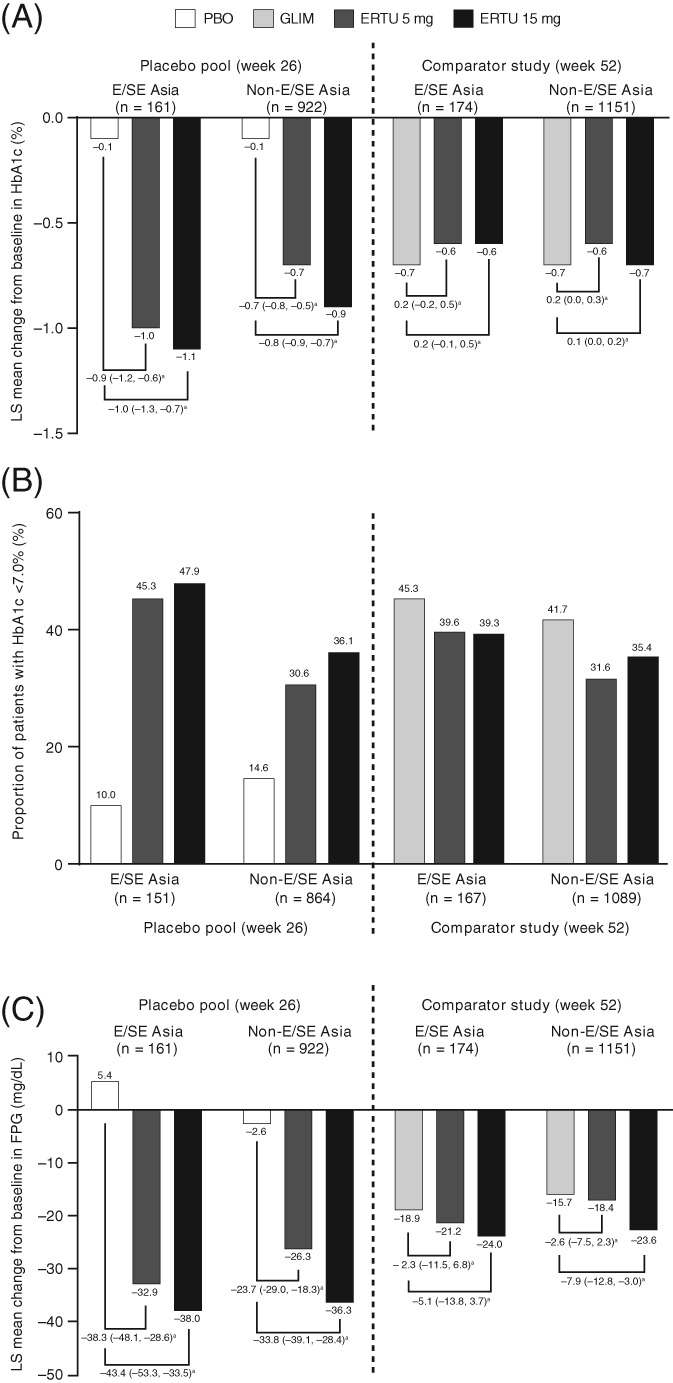
Figure 2.

(A) Least squares (LS) mean change from baseline in HbA1c; (B) proportion of patients with HbA1c <7%; (C) LS mean change from baseline in fasting plasma glucose (FPG) at week 26 and week 52 for East and Southeast (E/SE) Asian and non‐E/SE Asian patients (full analysis set [FAS] population, excluding rescue approach). CI, confidence interval; ERTU, ertugliflozin; GLIM, glimepiride; PBO, placebo.
aLS mean (95% CI) difference vs. placebo or glimepiride
