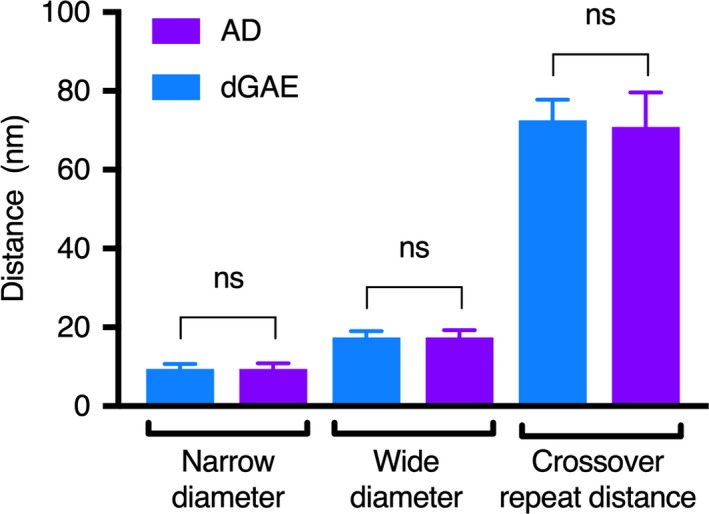
Figure 2.

Comparison of twisted dGAE filaments and PHFs from AD brain tissue. Data were analysed using one‐way ANOVA with multiple comparisons and Sidak’s multiple comparisons test. Eighty‐two images were analysed for dGAE using five grids. Forty‐three images were analysed for AD PHFs using three grids from one case. Narrow diameter comparison – mean diff. 0.03291 nm, 95% Cl of diff. −2.047 to 2.113 nm. Not significant (number of measurements – dGAE: 95, AD: 17). Wide diameter comparison – mean diff. −0.2626 nm, 95% Cl of diff. −1.763 to 1.711 nm. Not significant (number of measurements – dGAE: 101, AD: 26). Crossover repeat comparison – mean diff. 1.631 nm, 95% Cl of diff. −0.6283 to 3.890 nm. Not significant (number of measurements – dGAE: 66, AD: 15).
