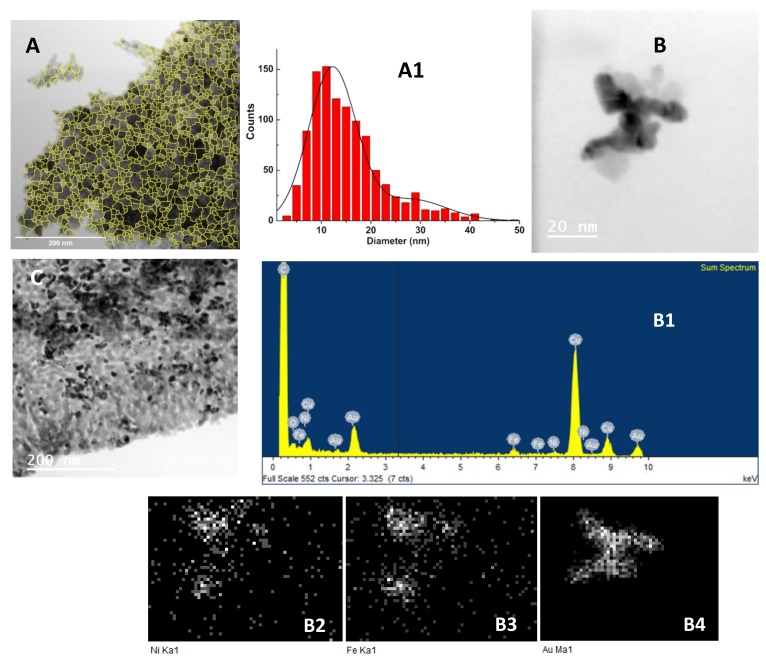
Figure 7.
TEM images of the nickel ferrite/Au nanoparticles. (A) Nickel ferrite nanoparticles decorated with gold nanoparticles (scale: 200 nm). (A1) Size histogram of image A and fitting to a Gaussian distribution. (B) Nickel ferrite nanoparticles decorated with gold nanoparticles (scale: 20 nm). (B1) Electron-dispersive X-ray (EDX) spectrum of TEM image B, using Ni (B2), Fe (B3), and Au (B4) X-ray emission lines. (C) Core/shell nickel ferrite/gold nanoparticles (scale: 200 nm).

