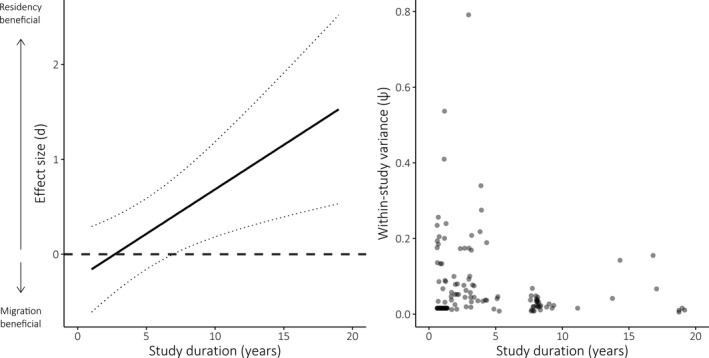
Figure 3.

Left: Predicted effect of study duration on effect size (d) for fitness measures of all species (n = 129). Positive effect size values indicate a benefit to residency, and negative values indicate a benefit to migration. Dotted lines indicate 95% confidence intervals. Right: Raw values of effect size variance varying with study duration
