. 2020 Mar 3;17(2):131–139. doi: 10.21873/cgp.20173

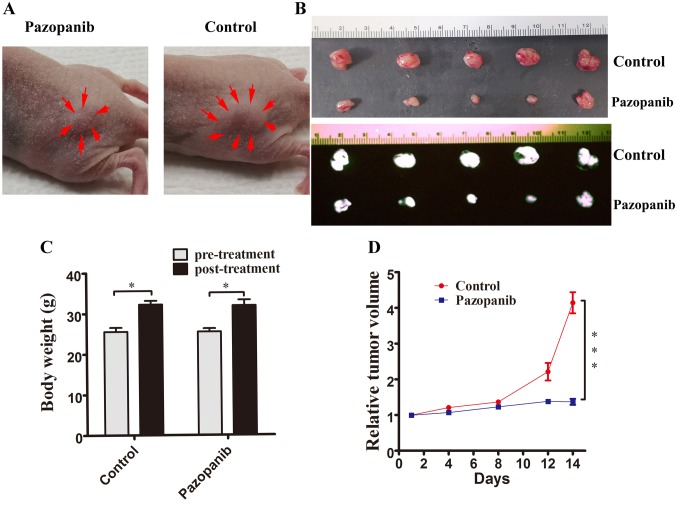
Figure 1. PAZ inhibited the growth of subcutaneously implanted CT26-GFP in nude mice in a model of colorectal cancer. (A) photographs of representative CT26 subcutaneous tumors of colorectal cancer in the PAZ and control groups at treatment day 14. Arrows indicate the margins of the tumors. (B) Photographs (upper panel) and fluorescence images (black and white; lower panel) of subcutaneous tumors from the control and the PAZ groups. (C) Mouse body weight. Bar graphs show mouse body weight in the PAZ and in the control groups at pre- and post-treatment. (D) Line graphs indicate the relative subcutaneous tumor volume (ratio of tumor volume at each time point to volume at the start of the treatment) for the PAZ and the control group. (N=5, *p<0.05; ***p<0.001).

Figure 1