. 2020 Mar 3;17(2):209–216. doi: 10.21873/cgp.20181

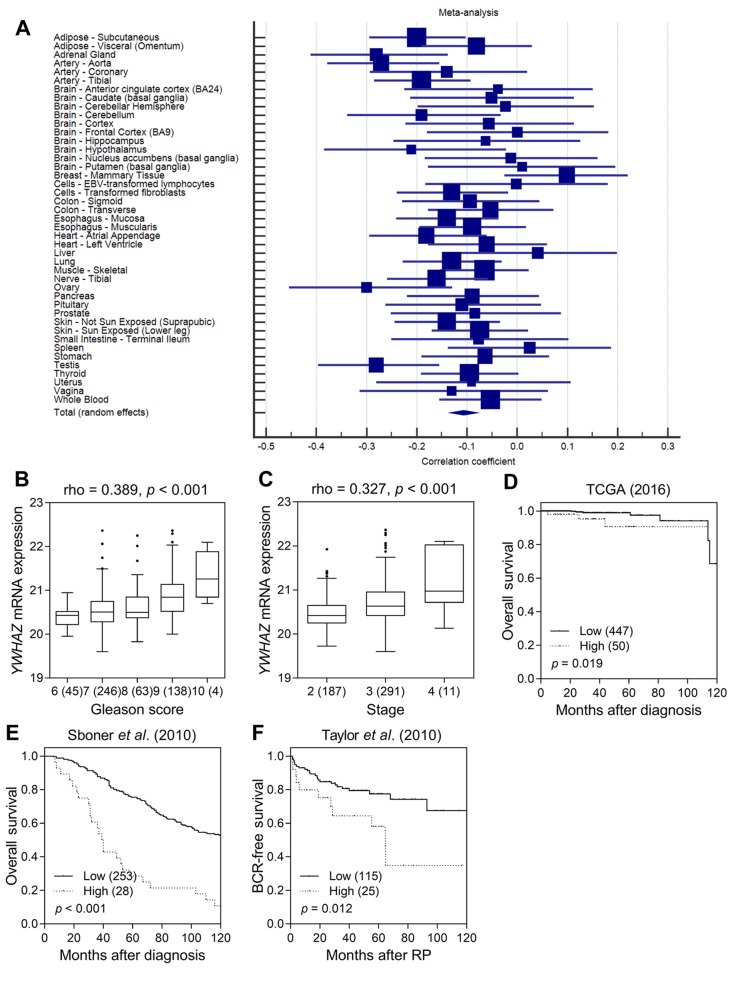
Figure 2. Functional analyses of YWHAZ rs2290291. (A) Forest plot for meta-analysis of the correlation between rs2290291 and YWHAZ expression in 9745 tissue samples from the GTEx dataset. Correlation of YWHAZ expression with prostate cancer progression. (B) High Gleason score and (C) high stage prostate cancers displayed significantly higher mRNA expression. Increased YWHAZ expression was significantly associated with poor (D) overall survival in the TCGA dataset, (E) overall survival in the dataset from Sboner et al. (2010), and (F) BCR-free survival in the dataset from Taylor et al. (2010). Patients were classified into low- and high-risk groups by an optimization algorithm for the minimum p-value. Numbers in parentheses indicate the number of patients. Rho: Spearman’s rank correlation coefficient.

Figure 2