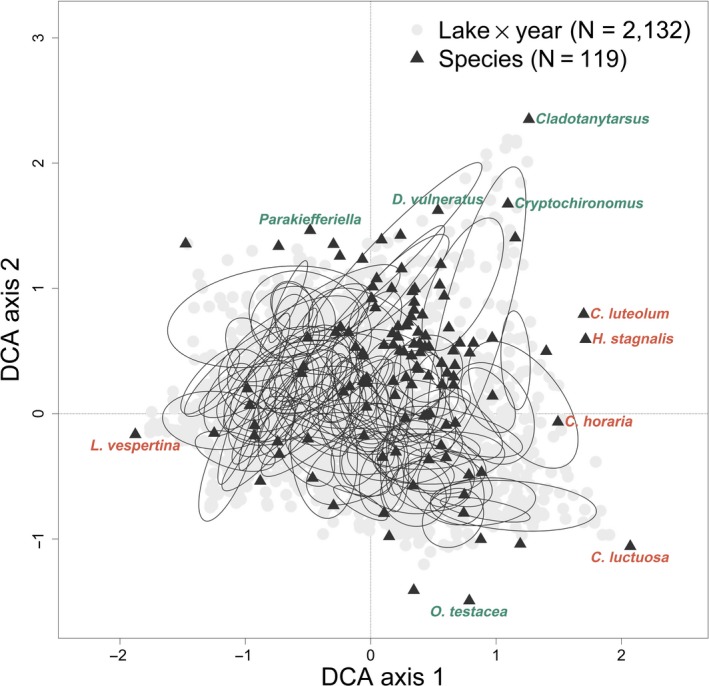
Figure 2.

Detrended correspondence analysis ordination biplot for the 105 lakes across all years with rare species downweighted. Species locations in ordination space are depicted with black triangles and lake scores (in a given year) are depicted in gray circles. Black ellipses are drawn around the standard deviation of point scores for each lake, by year. Detrended correspondence analysis (DCA) axis 1 eigenvalue = 0.38 and axis length = 3.67. Axis 2 eigenvalue = 0.25 and axis length = 3.39. The five taxa with the highest absolute loadings for DCA 1 and DCA 2 are labeled in orange and green, respectively
