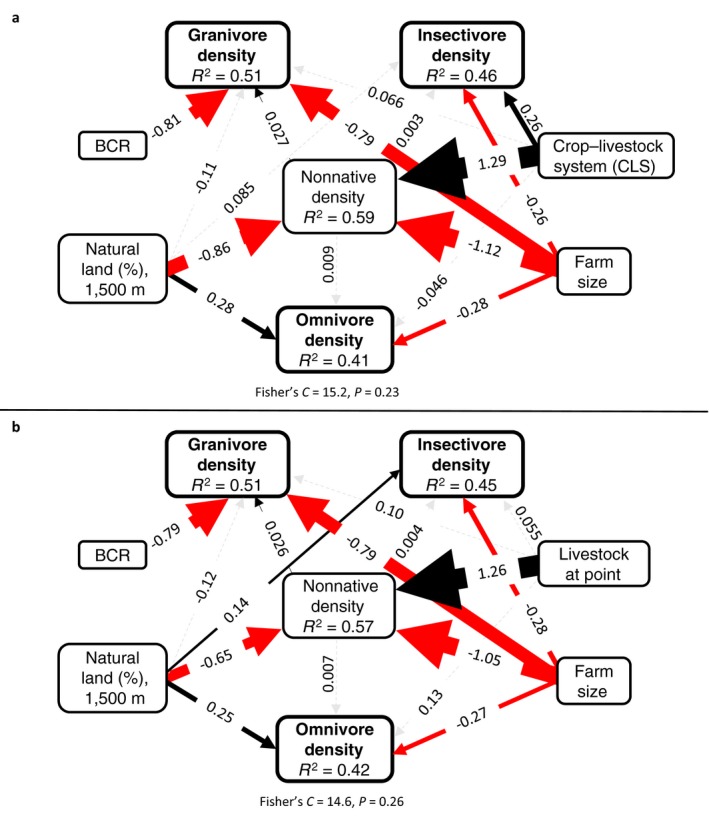
Figure 5.

Structural equation model showing links between (a) Bird Conservation Region (BCR), percent natural land cover (1,500 m radius), crop–livestock system, farm size, nonnative bird density, native granivore density, native insectivore density, and native omnivore density and (b) percent natural land cover buffered around a point (1,500 m radius), livestock presence at point, farm size, nonnative bird density, native granivore density, native insectivore density, and native omnivore density. Black solid lines indicate positive relationships, red solid arrows indicate negative relationships, solid circles indicate interactions, and dashed gray lines indicate nonsignificant relationships. Lines are scaled to coefficients.
