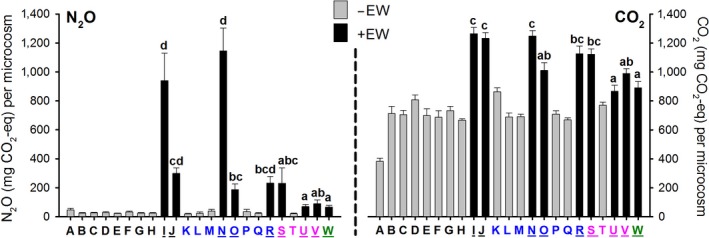
Figure 3.

Observed cumulative emissions of N2O and CO2 after 120 days (in mg CO2‐eq per microcosm). A nonparametric test (Independent‐samples Mann–Whitney U test) established the difference in cumulative emissions from treatments with earthworms present (black bars ‘+EW’) compared to treatments without earthworms present (grey bars ‘−EW’; black bars vs. grey bars: p < .001 for both N2O and CO2). Lowercase letter denotes differences between treatments with earthworms; any other differences occurring are reported in Table S3. Capital letters placed underneath each bar refer to the species combination given in Table 1. Colours indicate the number of species present: blue = 2 species present, pink = 4 species present and green = 8 species present. Underlined uppercase letters refer to species combinations that include an earthworm species
