
Figure 5.
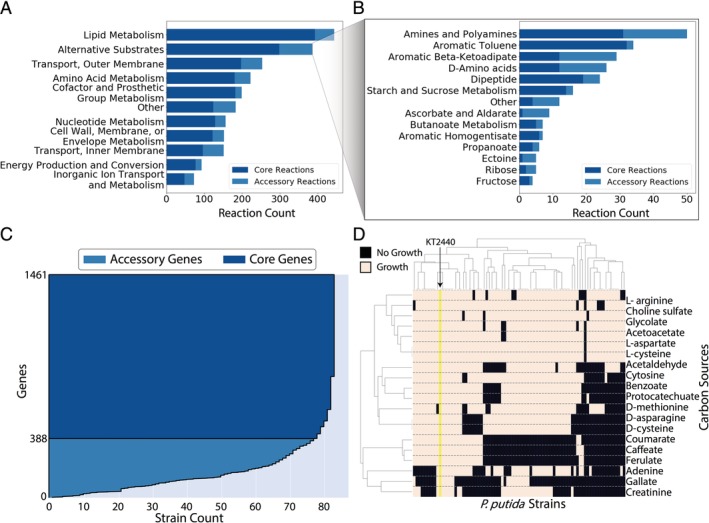
Multi‐strain comparison of P. putida species. A and B. The number of reactions predicted to be in the core‐genome vs. the pan‐genome of P. putida by grouped subsystems. Panel B provides a breakdown of subsystems involved in growth on alternative substrates. The polyhydroxyalkanoate metabolism subsystem is excluded from B and had 152 of 152 reactions in the core model. C. Dark blue shows genes in at least 95% of the strain models and considered to be part of the core genome. The lighter blue shows the accessory genes, which are responsible for the diversity between different strains. D. A clustered heatmap of growth capabilities of P. putida strains on select carbon sources. Clustered differences could be due to variances in environmental niches.