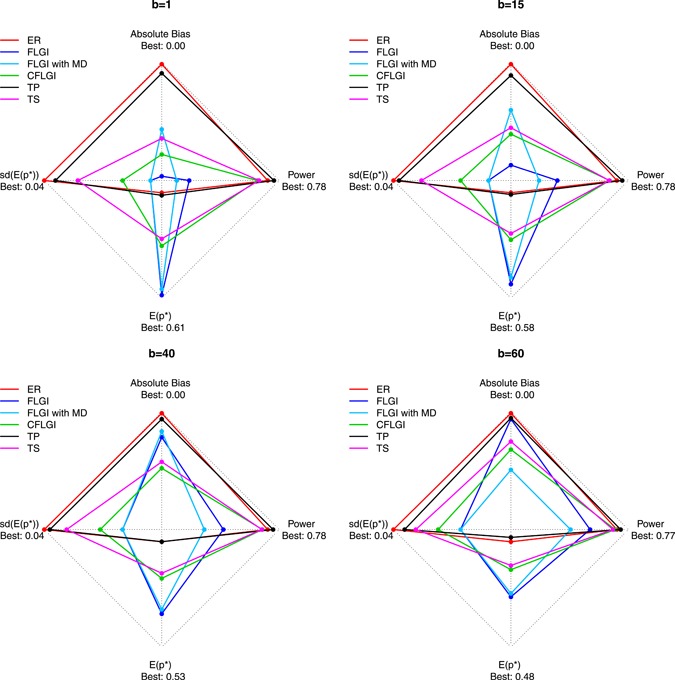
Figure 3.

The trade‐offs between the expected proportion of patients allocated to the superior arm, , power, average absolute bias in the treatment effect estimate and variability of patient allocations for the different designs, including normal FLGI and normal FLGI with missing data (MD), for block sizes in a three‐armed trial of size (assuming unknown variance). CFLGI, Controlled FLGI; ER, Equal Randomization; FLGI, Forward‐Looking Gittins Index; TP, Trippa Procedure; TS, Thompson Sampling [This figure appears in color in the electronic version of this article, and any mention of color refers to that version]
