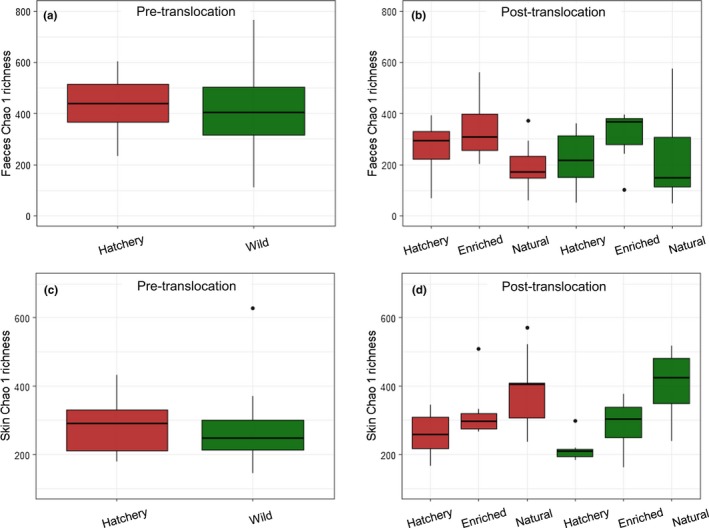
Figure 2.

Faecal and skin Chao1 richness measure pretranslocation (a, c; n = 24) and post‐translocation (b, d; n = 8), red shading indicates hatchery origin and green shading indicates wild origin fish [Colour figure can be viewed at http://wileyonlinelibrary.com]
