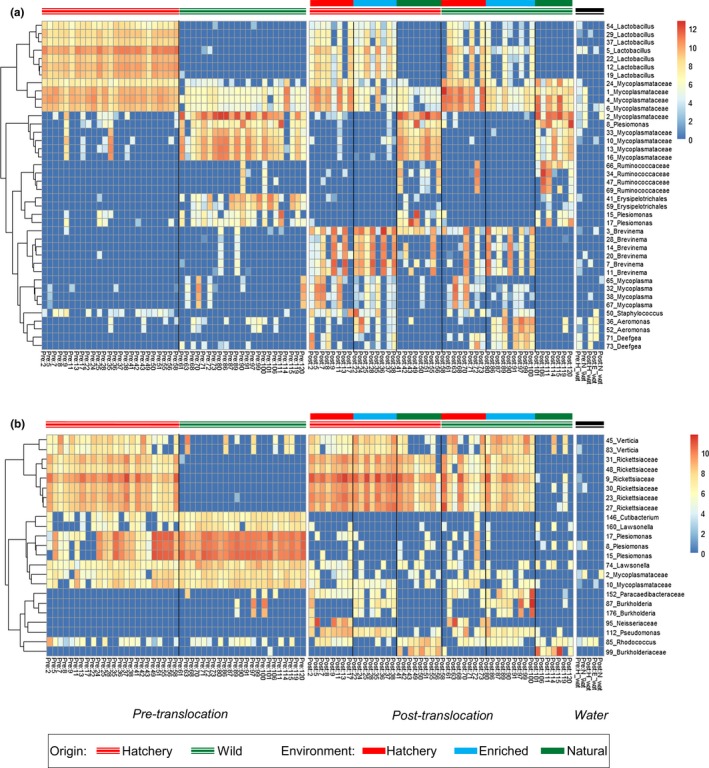
Figure 5.

Heatmap illustrating differential abundance of ASVs in the (a) faecal and (b) skin microbiome. Data presented are log 2 transformed read counts for the top 50 ASVs which showed differential abundance between experimental environments or origin (FDR < 0.01). Hierarchical clustering was based on an Euclidean distance metric [Colour figure can be viewed at http://wileyonlinelibrary.com]
