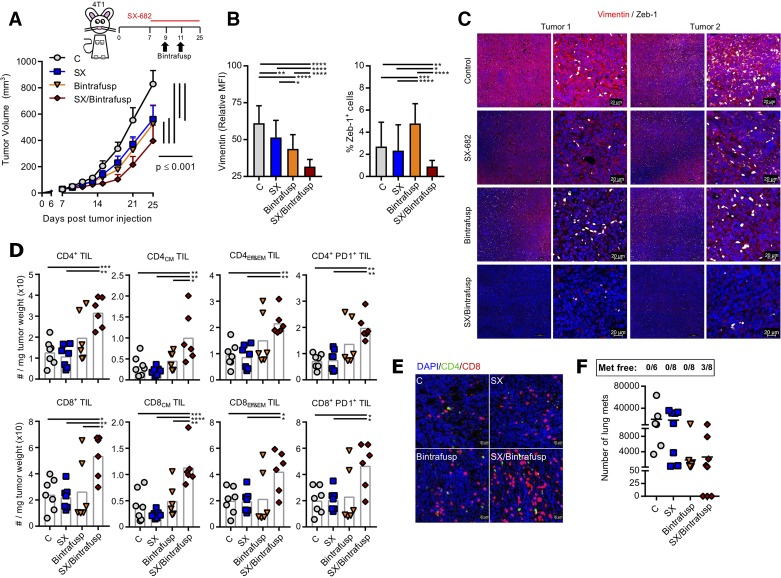
Figure 5.
SX-682 plus bintrafusp alfa in the 4T1 mammary carcinoma model enhances immune activation. (A) BALB/c mice were inoculated subcutaneously with 3×10⁴ 4T1 in the mammary fat pad. On day 7 mice were started on a control or SX-682 diet. On days 9 and 11 mice received intraperitoneal injections of 492 µg bintrafusp alfa. Tumors and organs were harvested and analyzed on day 25. Graph shows average tumor growth; n=7 (C) or 8 (SX, Bintrafusp, SX/Bintrafusp) mice/group. Data in (A) are representative of one of two independent experiments. (B, C) OPAL immunofluorescence staining of 4T1 tumors in each group was performed for vimentin and Zeb-1 and were quantified (B) with representative images shown (C). (D) Flow cytometry analysis of tumors on day 25. Immune cell subsets are defined as number of cells per tumor weight. (E) Representative images of tumors stained for CD4+ (green) and CD8+ (red) T cells by immunofluorescence. DAPI (blue) was used to stain nuclei. (F) Number of micrometastases quantified in the lungs of 4T1 tumor-bearing mice. Individual points represent data from one tumor. Error bars indicate mean±SD of biological replicates. *P≤0.05; **p≤0.01; ***p≤0.001; ****p≤0.0001 for two-way analysis of variance (ANOVA) in (A), one-way ANOVA followed by Tukey’s post hoc test in (B, D). MFI, mean fluorescence intensity; PD1, programmed death-1 receptor; TIL, tumor-infiltrating lymphocyte.

