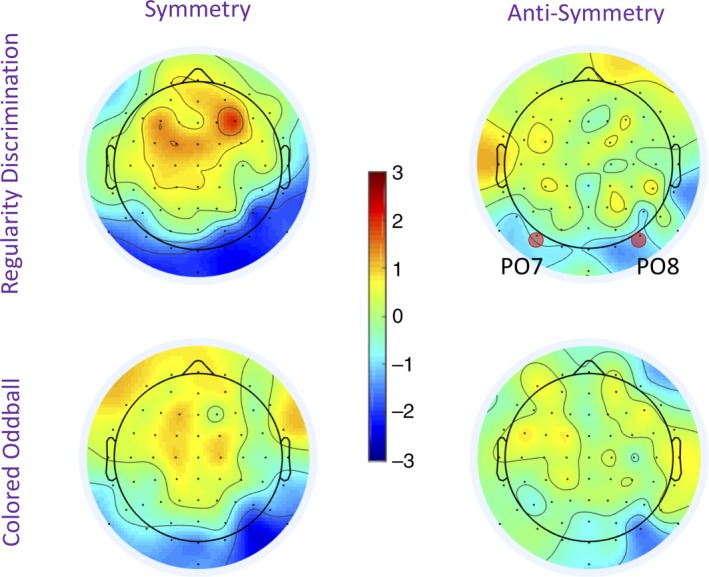
Figure 5.

Sustained posterior negativity (SPN) topoplots. Topographies were taken from data averaged over the 300‐ to 1,000‐ms interval. The color scale represents the amplitude of the difference from the random condition. Consequently, the SPN appears as blue at posterior electrodes. The SPN was stronger for symmetry than anti‐symmetry, but comparable in both tasks. It can also be seen that the SPN was right lateralized in both tasks [Colour figure can be viewed at http://wileyonlinelibrary.com]
