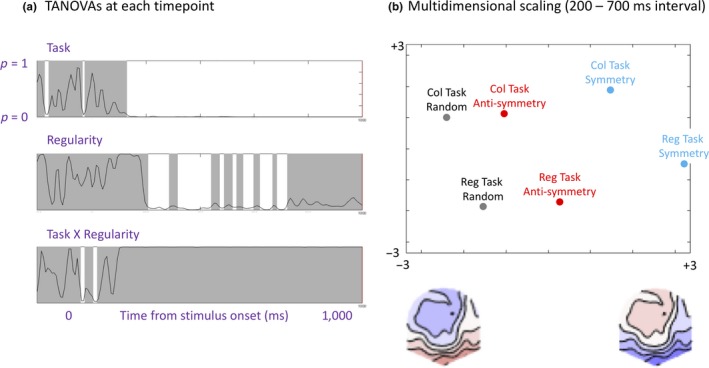
Figure 8.

Topographic ANOVA. (a) Task × Regularity topographic ANOVA was applied to each time point from −200 to 1,000 ms from stimulus onset. Significant intervals are marked white; non‐significant intervals are marked gray. (b) Multidimensional scaling plot showing the projection of the six mean topographies onto optimized 2D results space. This maps the difference between topographies, so data points close together come from conditions with similar topographies and vice versa. Schematic topographies below the X axis are not real data, but represent the spatial distribution of the first principal component [Colour figure can be viewed at http://wileyonlinelibrary.com]
