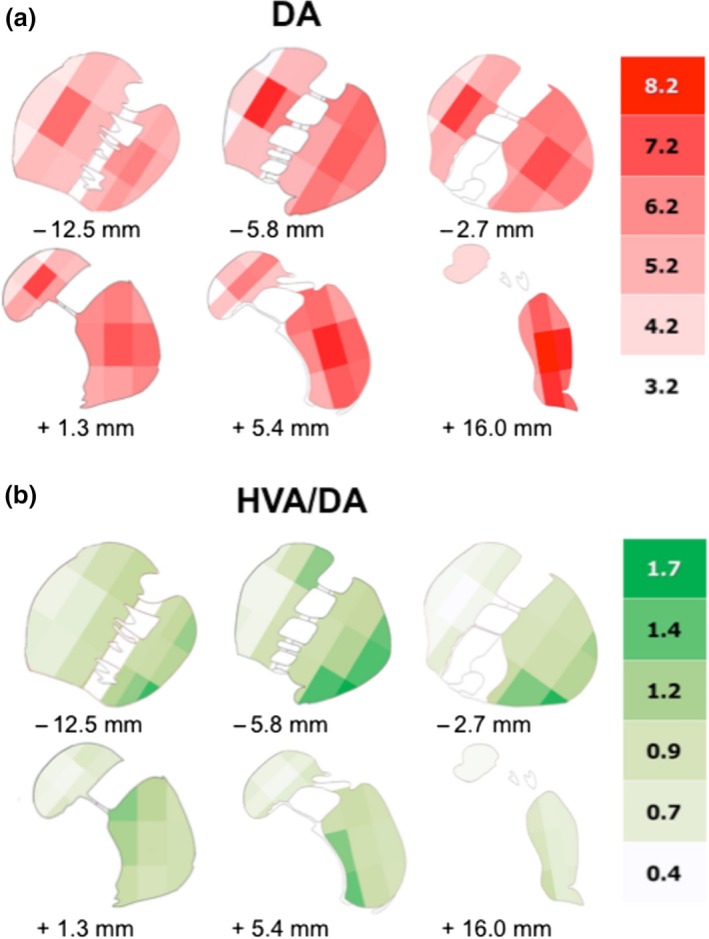
Figure 4.

Detailed distribution of DA and the molar ratio of HVA to DA in the human CN and PUT. (a) Detailed distribution of DA in the human CN and PUT as shown in six representative slices of the human striatum. In each coronal section the areas of CN and PUT were subdivided into nine parts. The schematic drawing indicates the varying concentrations of DA (ng/mg ww) within CN and PUT (number of brains = 7). (b) Detailed distribution of the molar ratio of HVA to DA (HVA/DA) in the human CN and PUT as shown in six representative slices of the human dorsal striatum. In each coronal section the areas of CN and PUT were subdivided into nine parts. The schematic drawing indicates the varying ratios of HVA/DA within CN and PUT (number of brains = 6).
