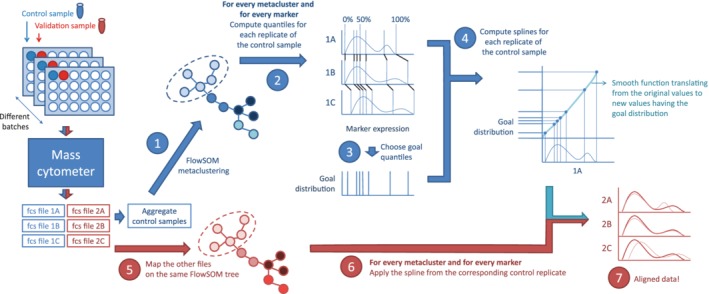
Figure 1.

Schematic overview of the proposed workflow. First the batch effects are learned on the control sample (blue part). Afterward, the other samples can be normalized (red part). When a validation sample is included on the plates, we can evaluate whether these aliquot measurements become more similar as well, as they should after correct normalization. [Color figure can be viewed at http://wileyonlinelibrary.com]
