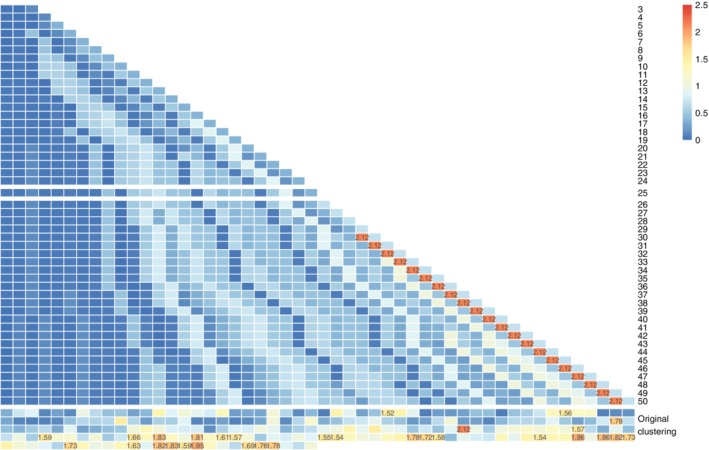
Figure 4.

Coefficient of variation results for several clustering results (varied from 3 to 50 final FlowSOM clusters [each one row in the figure] and the 225 original clusters [the bottom 5 rows]). Values are shown on the figure if they are higher than 1.5. We note that as the number of clusters increases, the coefficient of variation increases, as some clusters become batch‐specific. [Color figure can be viewed at http://wileyonlinelibrary.com]
