Figure 6.

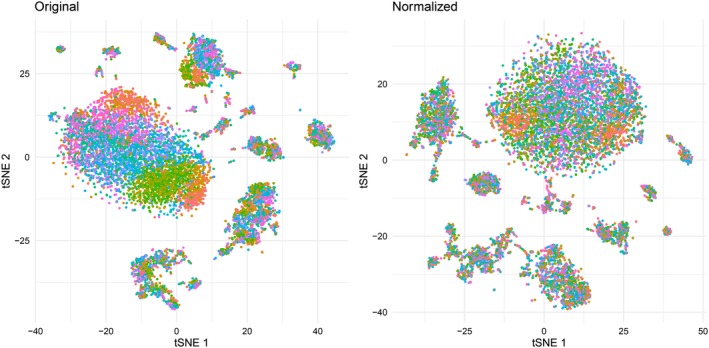
tSNE dimensionality reduction of 10.000 cells sampled from the 10 validation samples (1,000 cells each). Colored by sample (= batch). [Color figure can be viewed at http://wileyonlinelibrary.com]

tSNE dimensionality reduction of 10.000 cells sampled from the 10 validation samples (1,000 cells each). Colored by sample (= batch). [Color figure can be viewed at http://wileyonlinelibrary.com]