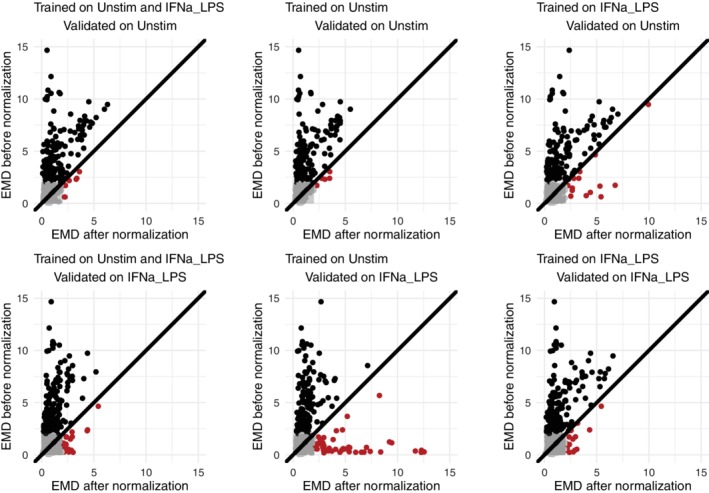
Figure 7.

Effect of different stimulations between the training and normalization data set. When the necessary range was not present in the reference samples, extrapolation of the splines introduced wrong transformations, indicated by dots below the diagonal line. [Color figure can be viewed at http://wileyonlinelibrary.com]
