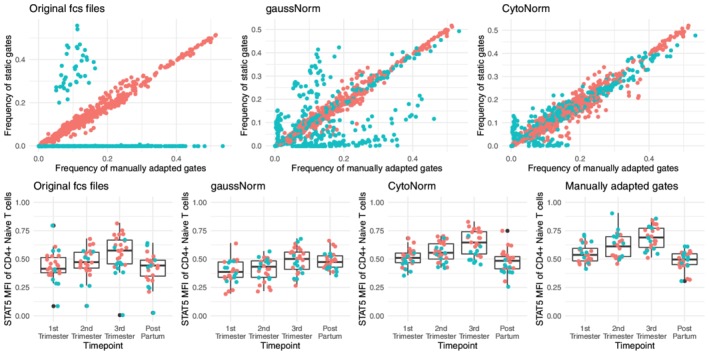
Figure 8.

Results on the patient files from the pregnancy study. Red dots: values from original cohort, Blue dots: values from the validation cohort. Top row: comparison of population frequencies acquired by manually adapted gates (x‐axis) and static gating (y‐axis). Applied on files before or after normalization (gaussNorm/CytoNorm). Bottom row: STAT5 MFI values for statically gated CD4+ Naïve T cells. [Color figure can be viewed at http://wileyonlinelibrary.com]
