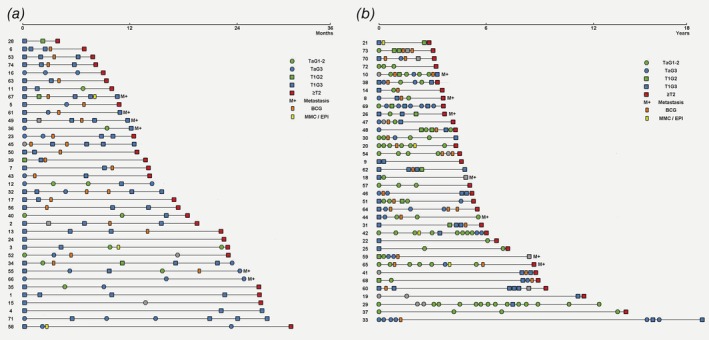
Figure 1.

Chronologic disease course for 73 patients with progressive UBC. Patient timelines are shown divided by median time to progression into (a) early progressors with less than 3 years between primary tumor and progression, and (b) late progressors, with more than 3 years to progression. Squares and circles represent tumor manifestations, whereas rectangles represent intravesical treatment courses. Placement of symbols that would overlap due to short time between events has been adjusted minimally. [Color figure can be viewed at http://wileyonlinelibrary.com]
