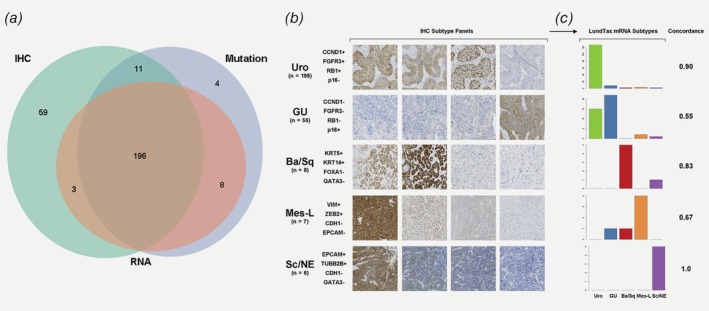
Figure 2.

Overlap of data types and concordance between IHC‐ and mRNA‐based molecular subtype classification. Venn diagram in (a) counting tumors for which IHC (green), RNA (blue) and mutation (red) data are available. All three data types overlapped for 193 tumors. (b) The numbers of tumors classified by IHC into each of the five major UBC molecular subtypes are shown. The four IHC stains used for subtyping are shown for a typical case of each type. The tumor used to exemplify the Urothelial‐like subtype in panel b is also shown in Supporting Information Figure S3. Barplots in (c) show the proportion of LundTax mRNA subtypes within the IHC subtypes, and the per‐subtype concordance between the two classification methods. [Color figure can be viewed at http://wileyonlinelibrary.com]
