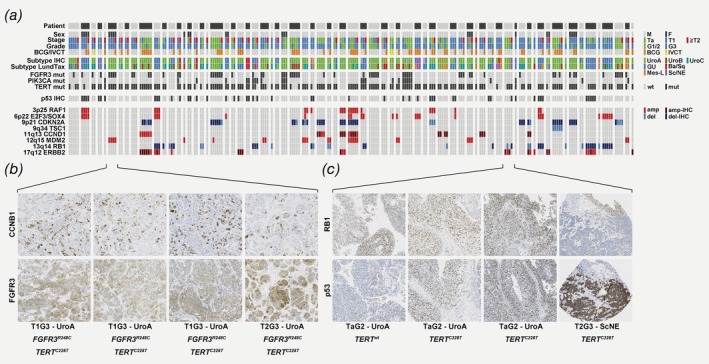
Figure 5.

Progression tumors are either identical to previous recurrences or undergo subtype shifts. A summary of clinicopathological data, molecular subtype, mutations, p53‐status and inferred copy number data is shown in (a) ordered by patient, then by tumor number. For inferred copy number alterations, blue boxes indicate gene expression profiles consistent with loss, and red boxes indicate profile consistent with amplification. For CDKN2A, CCND1, RB1 and ERBB2, tumors with IHC‐validated inferred copy number status is indicated with dark blue/dark red boxes. (b) Three NMI tumors and the progression tumor from patient 6 show identical molecular profile, including FGFR3 overexpression, FGFR3 mutation, TERT mutation and inferred MDM2 amplification. (c) Three NMI tumors from patient 57 show radically shifted profiles compared to the progression tumor. The NMI tumors are all TaG2 UroA tumors with ERBB2 overexpression, and TERT mutation detected in the recurrences but not the primary. The progression tumor is T2G3 of Sc/NE subtype with identical TERT mutation, but with molecular changes including RB1 loss, altered p53‐pattern and absence of ERBB2 overexpression. [Color figure can be viewed at http://wileyonlinelibrary.com]
