
Figure 8.
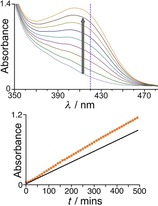
Cage‐catalysed hydrolysis of 2NDP. Top: evolution of UV spectra showing production of product 2‐nitrophenolate in the presence of cage H: its appearance was measured by absorbance at 420 nm (dashed line). Bottom: comparison of rates of product appearance (conditions: 0.5 mm 2NDP in borate‐buffered H2O at pH 8.55 and 303 K) in the absence of cage H (black line) or the presence of H (0.21 mm; orange dots).