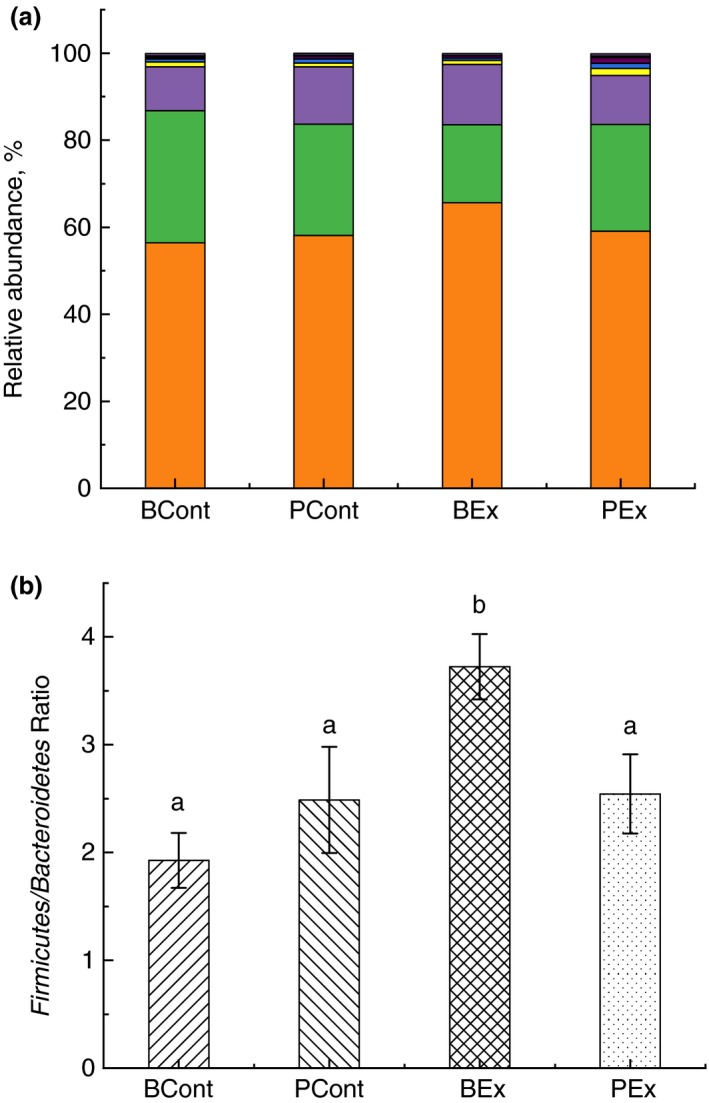
Figure 6.

Analysis of the gut microbiota composition of rats at the phylum level. (a) Relative abundance of phyla. All phyla present in abundance of <0·1% are presented as other ( Others;
  Cyanobacteria;
  TM7;
TM7;  Elusimicrobio;
  Deferribacteres;
  Verrucomicrobia;
  Proteobacteria;
  Tenericutes;
  Actinobacteria;
  Bacteroidetes;
  Firmicutes); (b) Firmicutes to Bacteroidetes ratio. Rats were pretreated by oral gavage with Bacillus subtilis BSB3 (BSB3) or with PBS and were either exposed forced running or remained sedentary (n = 6 rats per condition). BEx, pretreated with BSB3, undergoing forced running; BCont, pretreated with BSB3 remaining sedentary; PEx, pretreated with PBS, undergoing forced running; PCont, pretreated with PBS remaining sedentary. Data with different superscript letters signify groups are significantly different (P < 0·05). [Colour figure can be viewed at https://www.wileyonlinelibrary.com]
