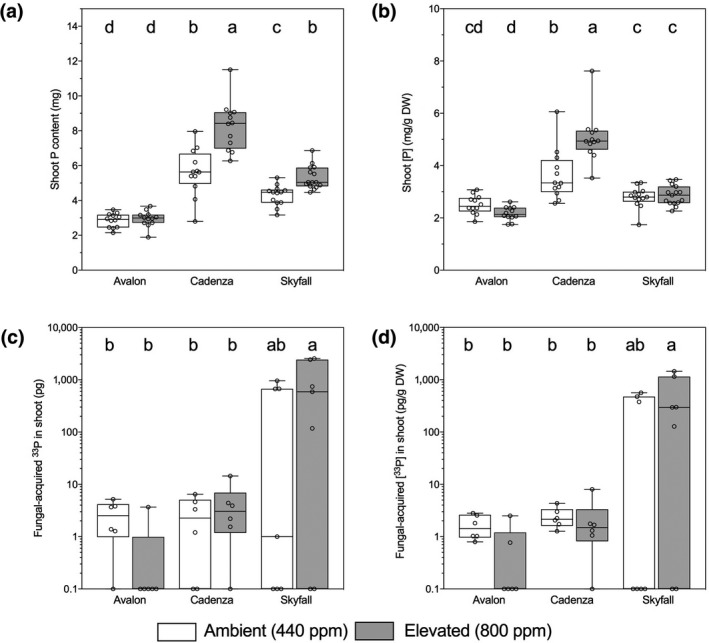
Figure 3.

Shoot phosphorus (P) content (a) and concentration (b) of wheat (Triticum aestivum L., cv. Avalon, Cadenza, Skyfall) grown at ambient (440 ppm, white boxes) and elevated (800 ppm, grey boxes) CO2. Shoot content (c) and concentration (d) of fungal‐acquired 33P. Plants were grown at ambient (440 ppm, white boxes) and elevated (800 ppm, grey boxes) CO2. Bars sharing letters are not significantly different, where p > .05 (ANOVA, Tukey post hoc test). Data were log10 transformed where data assumptions were not met
