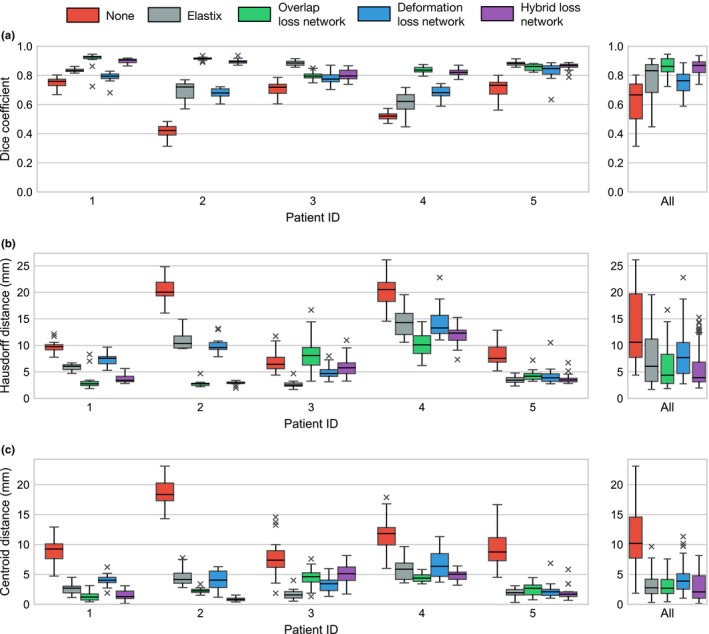
Figure 5.

Box plots of the (a) Dice coefficients, (b) Hausdorff distances, and (c) prostate centroid distances for no registration, Elastix, and the three convolutional neural network variants per patient. Each box displays the distribution of the 20 registration problems for a single fold of the network in which that patient was in the test set. [Color figure can be viewed at http://wileyonlinelibrary.com]
