Figure 7.

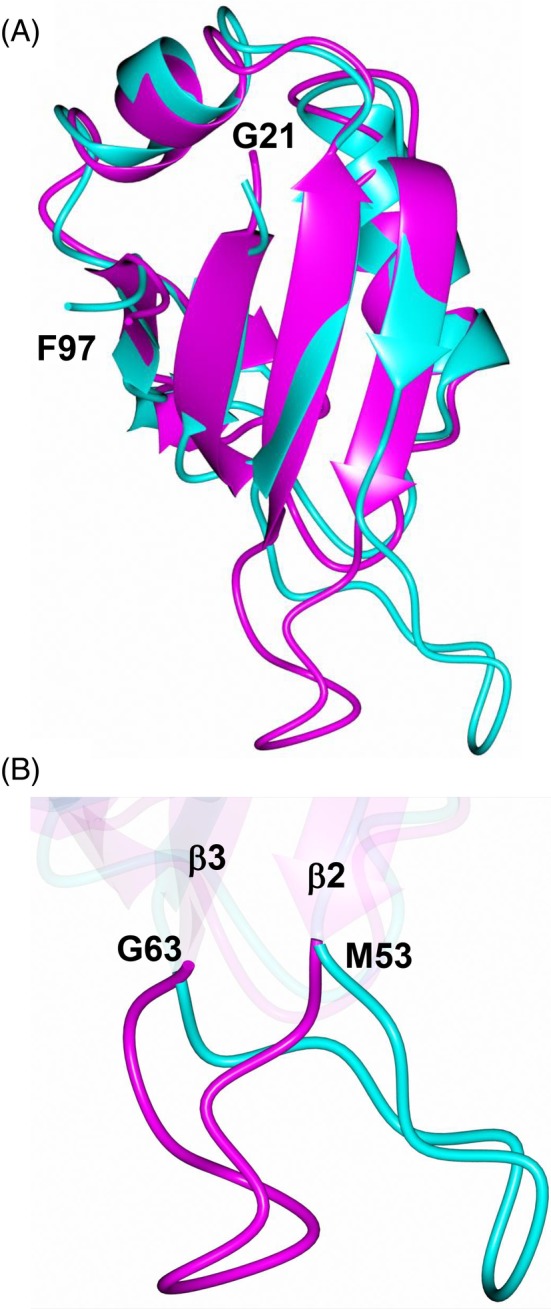
Comparison of the MSI2‐RRM1 crystal (magenta) and solution NMR (cyan) structures. A, Superposition of the NMR structure onto subunit A of the crystal structure. B, Zoomed‐in view of the conformational differences in the loop spanning β2‐β3

Comparison of the MSI2‐RRM1 crystal (magenta) and solution NMR (cyan) structures. A, Superposition of the NMR structure onto subunit A of the crystal structure. B, Zoomed‐in view of the conformational differences in the loop spanning β2‐β3