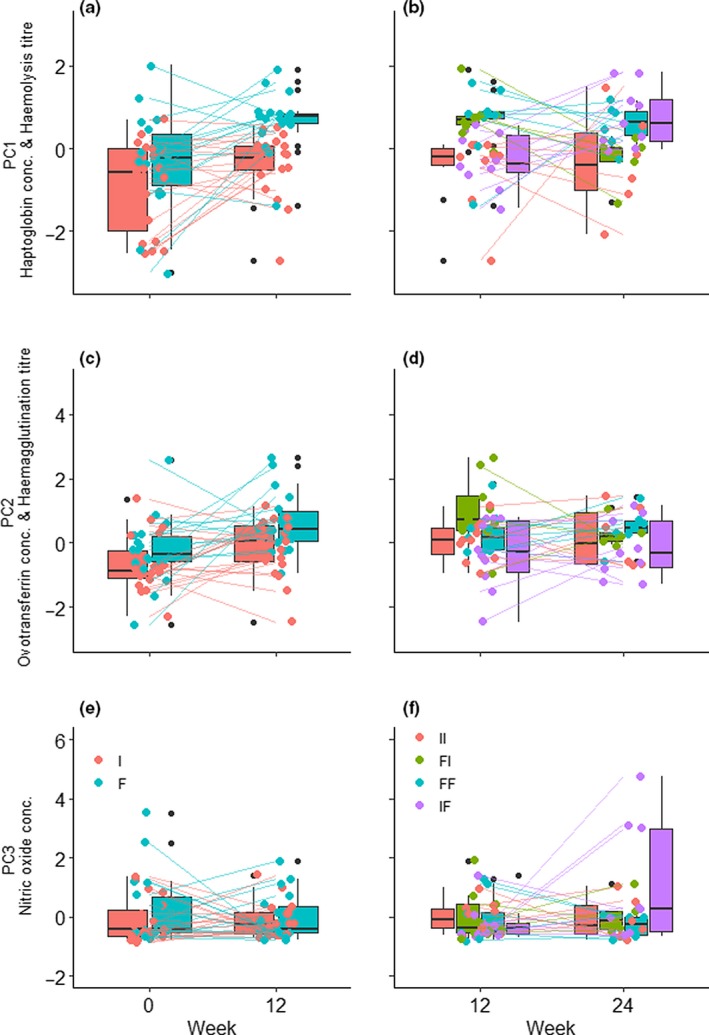
Figure 2.

Effect of diet treatment on (a–b) PC1 (decreasing haptoglobin concentration and increasing haemolysis titre), (c–d) PC2 (increasing ovotransferrin concentration and haemagglutination titre) and (e–f) PC3 (increasing nitric oxide concentration) in the common bulbul. Bars show group medians while lines connect individuals. A subset of each treatment was switched to alternative diet treatment at week 12: FI‐fruit to invertebrate, IF‐invertebrate to fruit, FF‐ fruit throughout and II‐invertebrate throughout. Black dots are outliers from box plots while coloured dots are individual points
