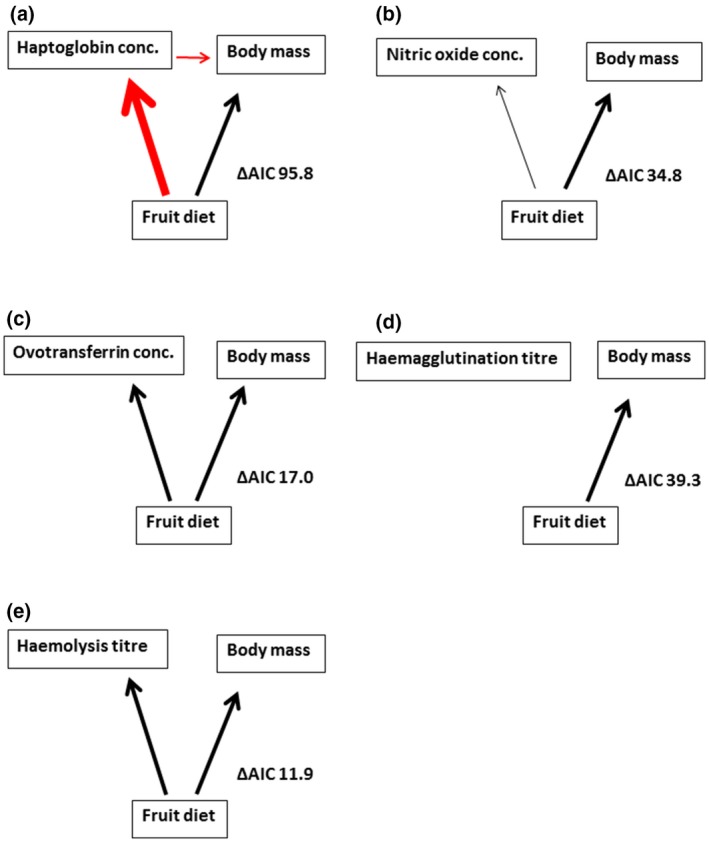
Figure 6.

Rudimentary path diagrams showing path of diet treatment effect on body mass and immune indices ((a) haptoglobin concentration, (b) nitric oxide concentration, (c) ovotransferrin concentration, (d) haemagglutination titre and (e) haemolysis titre) in common bulbuls fed on fruit or invertebrates. Invertebrate diet was set as the model intercept. Only significant relationships are shown. Difference between the two alternative indirect pathways of diet effect tested are shown as ΔAIC (solid lines vs. dashed lines, Figure 1). Arrows indicate directionality of causal relationships. Width of arrows indicate the strength of an effect (scaled based on standardized estimates from structural equation models—Table S4). Red arrows indicate negative effects and black arrows positive effects. Overall, diet affects body mass and immune function directly for all immune indices except haemagglutination titre, but indirectly affects body mass through effect on haptoglobin concentration—body mass decreases with increased haptoglobin concentration
