Figure 2.

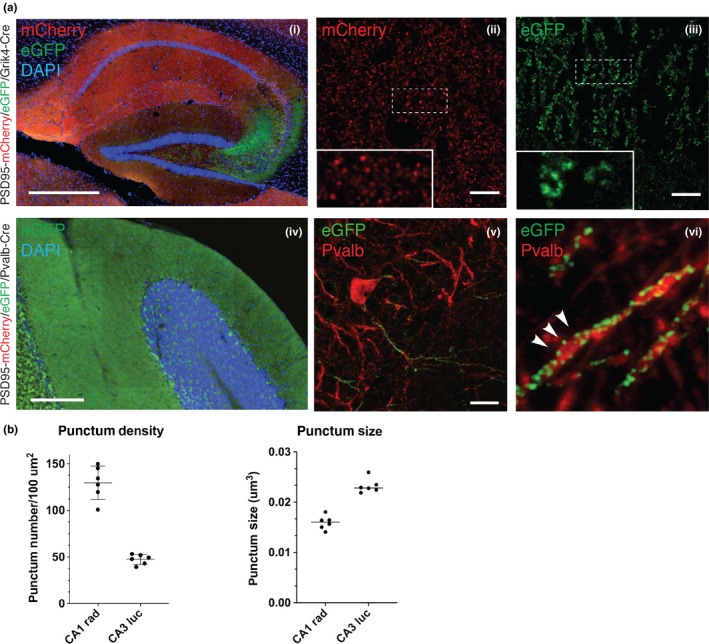
Fluorescence imaging of conditional PSD95 tagging mice reveals differential PSD95 synapse types in different populations of neurons. (a) Fluorescence imaging in the hippocampal regions of the PSD95c(mCherry/eGFP); Grik4‐Cre mice. (i) Low‐magnification view in the hippocampal region. Note that the CA3 subregion shows pronounced native eGFP fluorescence compared with mCherry red fluorescence in other hippocampal subregions. Scale bar: 0.5 mm. (ii,iii) Representative direct fluorescence images of CA1 and CA3 subregions demonstrating distinctive PSD95‐mCherry (ii) or PSD95‐eGFP (iii) punctum pattern in stratum lucidum and stratum radiatum, respectively. Insets are 5× magnifications of the boxed regions in the main images. Scale bars: 10 μm. (iv) Low‐magnification micrograph of the cerebellum in PSD95c(mCherry/eGFP); Pvalb‐Cre mice. Native eGFP fluorescence was detected in the molecular layer of the cerebellum, as well as the pinceau termini of basket cells. Scale bar: 0.5 mm. (v) Representative image of CA3 Pvalb‐positive neurons, labelled by anti‐PV235 staining (red) together with direct GFP fluorescence of PSD95‐eGFP (green). Scale bar: 10 μm. (vi) 5× magnification of region from v. Discrete PSD95‐eGFP puncta were detected along the Pvalb‐positive neuronal processes (arrowheads). (b) Quantification of PSD95 punctum density and size in CA1 and CA3 subregions of the hippocampus. Error bars: mean ± SEM; unpaired, two‐tailed t test, p < .0001 (punctum density), p < .0001 (punctum size), n = 2 mice [Colour figure can be viewed at http://wileyonlinelibrary.com]
