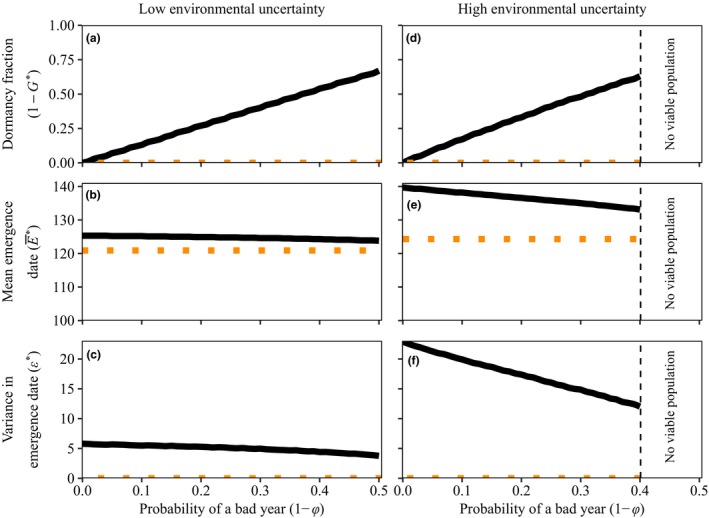
Figure 4.

Optimal trait values as a function of the probability of a bad year () for the density‐independent continuous season model. As the probability of encountering a bad year increases, the need for dormancy, also increases (panels a and d). Therefore, both the mean emergence date (panels b and e) and the variance in emergence date (panels c and f) decrease. This effect is especially strong in case of high uncertainty about the start of favorable growing conditions (right column). The horizontal‐dotted lines indicate the optimal strategy when maximising arithmetic mean fitness. Parameters are , = 0.9, . Parameter in panels a, b and c, and in panels d, e and f.
