
Figure 3.
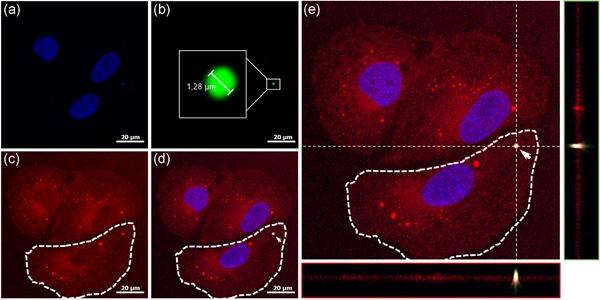
HCEC‐1CT cells have internalized gz93‐eGFP PBs after 4 hr of incubation. The cell nucleus was stained with Hoechst 33342, displayed in blue (a), gz93‐eGFP PBs emit green fluorescence (b), and the cell membrane and intracellular structures were stained in red with FM4‐64 (c). When all channels are merged (d) an orange signal results from the overlay of the green and red fluorescence that indicates the internalization of gz93‐eGFP PB into HCEC‐1CT cells. The cell was imaged in 32 sections (with a step size of 0.7 µm), and the cell is shown in the xy‐axis at z = 11. yz‐ (e, green panel) and xz‐projections (e, red panel) clearly confirm the internalization of the analyzed PB (arrow). The bar represents 20 µm. eGFP, enhanced green fluorescent protein; PBs, protein bodies [Color figure can be viewed at wileyonlinelibrary.com]