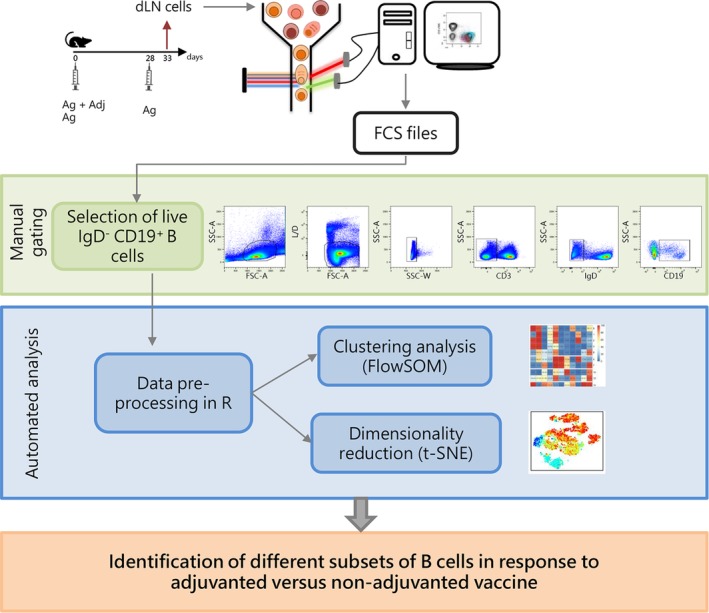
Figure 1.

Experimental design and workflow of data analysis. C57BL/6 mice were subcutaneously primed with antigen alone (Ag) or combined with the CAF01 adjuvant (Ag + Adj) and boosted with antigen alone 28 days later. Draining lymph nodes (sub iliac, medial, and external) were collected five days after booster immunization. Cells collected were stained with antibodies in order to identify different B cells subsets, and analyzed with flow cytometry. B cells were sequentially gated as lymphocytes live single CD3− IgD− CD19dim/high cells in FlowJo v10 as shown in dot‐plots. Gated B cells were exported in R environment as uncompensated flowSet, an R object that includes all FCS files. In the preprocessing step, data were compensated, logicle transformed, and scaled. The flowSet was analyzed with both clustering algorithm (FlowSOM) and dimensionality reduction (t‐SNE) in order to identify, on the basis of surface markers expression, different B cell subsets induced by vaccination. [Color figure can be viewed at https://wileyonlinelibrary.com]
