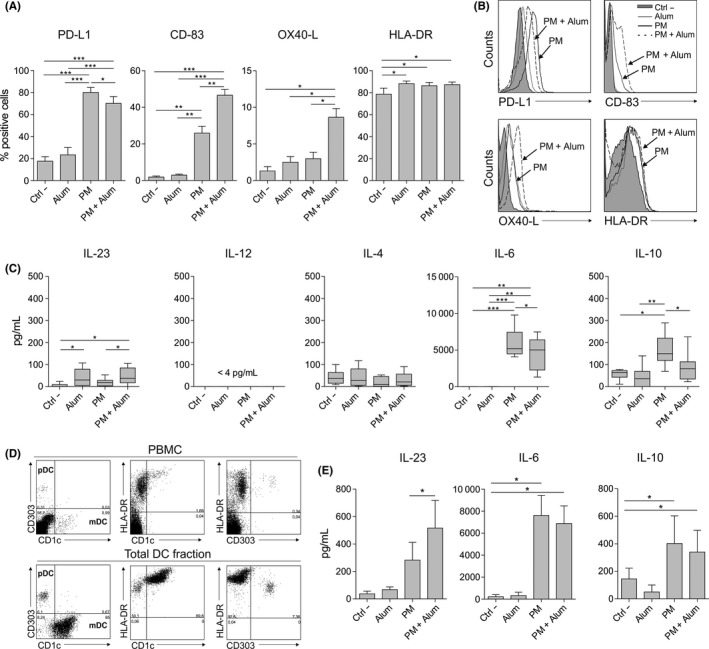
Figure 1.

Alum alters the phenotype and function induced by PM in human DCs from healthy donors. A, Percentage of positive cells after stimulation of hmoDCs with medium (Ctrl ‐), alum, PM or PM with alum for 18 h (n = 5‐7). B, Flow cytometry representative histograms. C, Cytokine production after stimulation of hmoDCs with the indicated stimulus for 18 h (n = 7). D, Representative dot plots for pDCs and mDCs in PBMCs and the enriched total DC fraction. E, Cytokine production after stimulation of total blood DCs with the indicated stimulus for 18 h (n = 6). Paired Student t test: *P < .05, **P < .01 and ***P < .001
